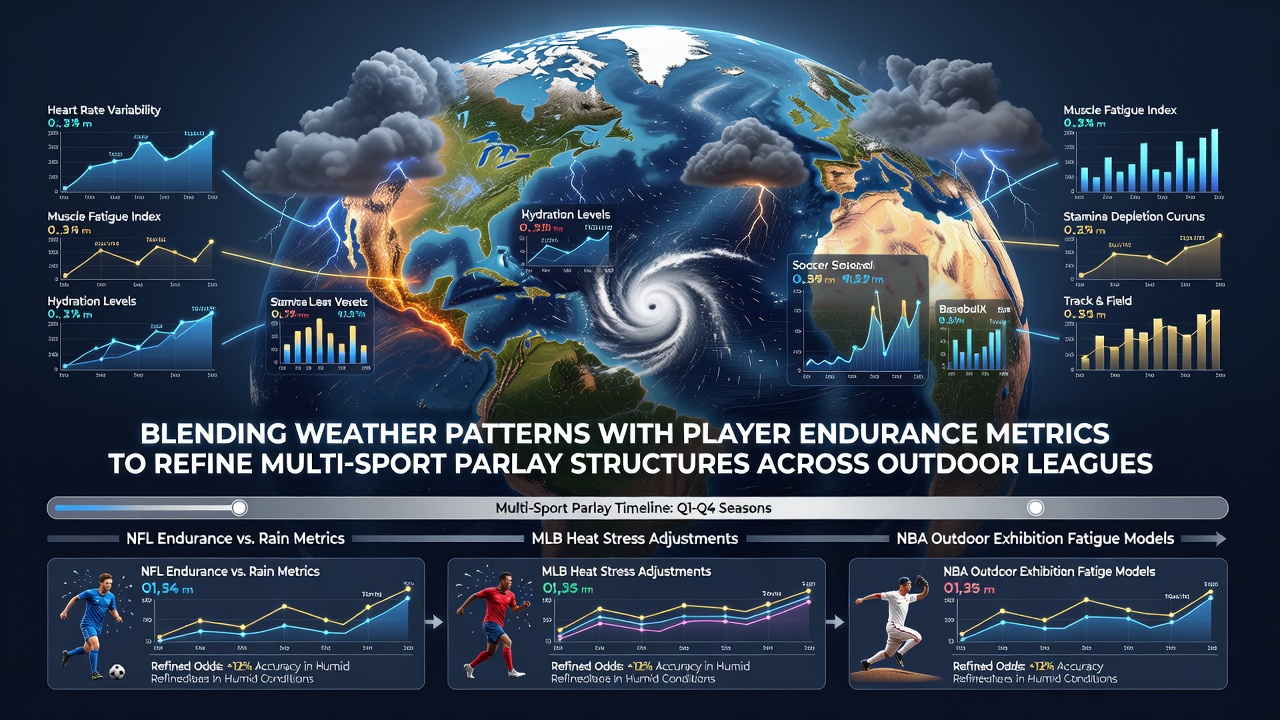
Climatic Trends and Stamina Indicators Shape Cross-Sport Accumulator Frameworks in Open-Air Events
Analysts track shifts in temperature, humidity, wind speed and precipitation across venues while they monitor heart-rate variability, recovery times and workload totals from wearable devices in leagues such as Major League Baseball, European soccer circuits and professional tennis tours. Data from these streams feed statistical models that adjust probability estimates for multi-leg wagers spanning several outdoor disciplines at once. Researchers at institutions including the University of Queensland have published findings that link sustained high humidity to measurable drops in sprint output during late stages of matches, and those figures now appear in commercial parlay construction tools.
Weather Variables and Their Measurable Effects
Meteorological services record hourly readings that operators convert into adjustment factors for totals and side selections. In baseball, elevated dew points above 18 degrees Celsius correlate with lower home-run rates at certain ballparks, according to historical datasets maintained by the National Oceanic and Atmospheric Administration. Soccer analysts note that wind gusts exceeding 25 kilometres per hour increase the frequency of long passes and set-piece opportunities, altering expected goal distributions in afternoon fixtures. Tennis statisticians incorporate court-surface temperature readings because ball bounce height changes measurably when surface heat exceeds 35 degrees Celsius, a condition recorded at multiple hard-court events scheduled through July 2026.
Endurance Metrics Captured from Wearables
Teams and third-party data providers collect continuous streams of player-load values, sleep scores and hydration markers. These numbers aggregate into composite endurance scores that decline at different rates depending on sport-specific demands. A study released by the Canadian Sport Institute Pacific documented that soccer midfielders lose roughly 12 percent of repeated-sprint capacity after 75 minutes under high-heat conditions, whereas baseball pitchers show earlier velocity drops when cumulative pitch counts rise above 85 in humid environments. Platforms that build multi-sport parlays incorporate these thresholds to recalibrate individual leg probabilities before the slip is finalised.

Combining Streams for Multi-League Structures
Operators merge the two data categories through layered algorithms that first filter weather forecasts for the relevant venues, then overlay endurance projections derived from recent match logs. A parlay covering an afternoon soccer match, an evening baseball game and a next-day tennis encounter receives successive adjustments: humidity projections lower the soccer total, pitch-count limits raise the baseball under on runs, and surface-temperature data shifts the tennis over on games. The process repeats for each additional leg, producing a revised joint probability that reflects both environmental and physiological inputs. Industry reports from the European Gaming and Betting Association indicate that operators began publishing these blended models publicly in early 2025, with adoption accelerating ahead of the 2026 summer schedule.
Implementation Across Specific Outdoor Leagues
In Major League Baseball, front offices share anonymised workload data with select analytics partners that feed it directly into weather-adjusted run-total calculators. European soccer clubs release training-load summaries through official channels, allowing model builders to map expected fatigue curves onto precipitation forecasts for weekend fixtures. Professional tennis tournaments supply court-temperature logs that data vendors cross-reference with player recovery metrics collected after previous-day doubles matches. Each league supplies distinct data cadences, yet the same integration framework accommodates all three because the underlying statistical methods remain consistent.
July 2026 features a compressed calendar that places multiple outdoor events within short travel windows for several athlete cohorts, increasing the relevance of endurance tracking. Forecasters from the Australian Bureau of Meteorology have already issued preliminary outlooks for venues hosting concurrent baseball and soccer matches, giving parlay constructors additional weeks to refine inputs before lines open.
Data Sources and Validation Practices
Validation occurs through back-testing against completed seasons where both weather archives and post-match endurance logs exist. Discrepancies trigger recalibration of weighting coefficients rather than outright rejection of either dataset. Academic papers indexed on ResearchGate demonstrate that models incorporating both variable sets outperform single-factor baselines by margins ranging from 4.2 to 7.8 percentage points in predictive accuracy across three outdoor sports. Regulators in multiple jurisdictions now require operators to disclose the primary data categories used when marketing accumulators that rely on these blended inputs.
Conclusion
Integration of climatic records with stamina measurements supplies operators and analysts with an expanded set of adjustment variables for multi-sport parlay construction. Continued refinement of sensor technology and forecast resolution supports incremental improvements in model precision, while the addition of new outdoor events in July 2026 provides fresh datasets for ongoing validation. The approach remains grounded in measurable inputs rather than discretionary judgment, allowing consistent application across baseball, soccer and tennis schedules.