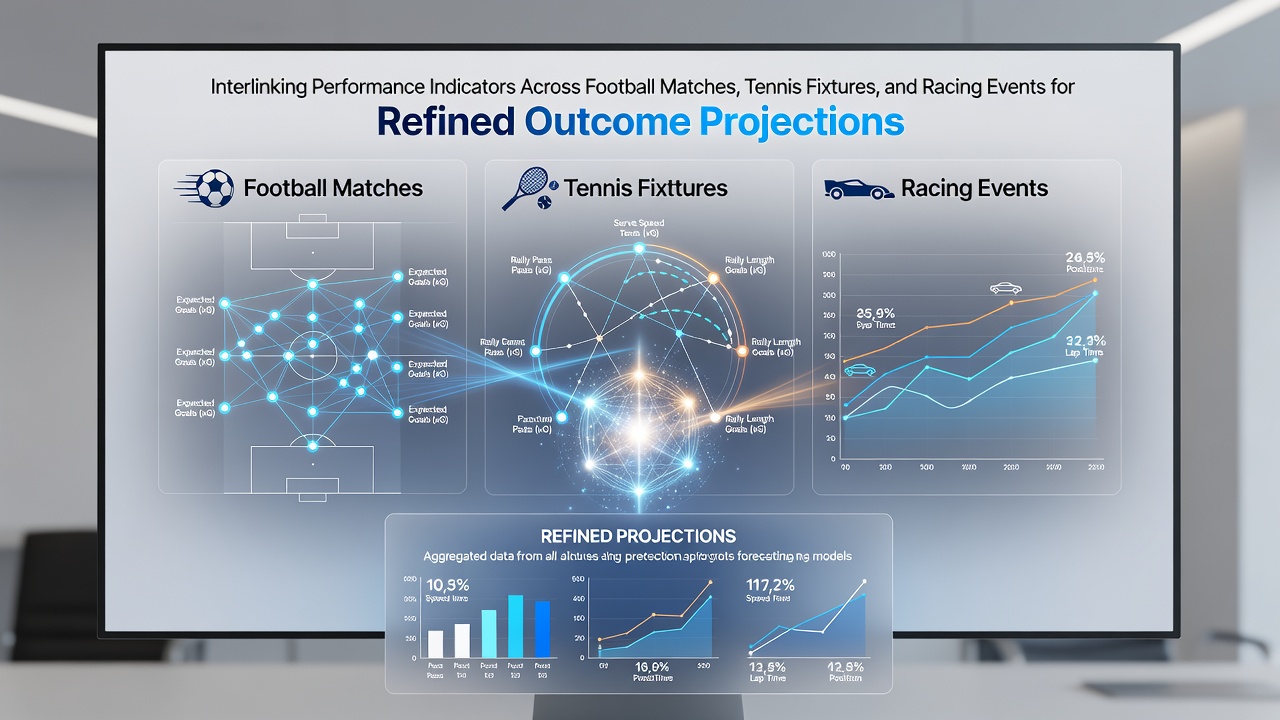
Data Bridges Between Sports: Integrating Performance Indicators from Football Matches, Tennis Fixtures, and Racing Events
Performance indicators from different athletic disciplines often share underlying patterns that analysts track when building projection models, and researchers continue to examine how these shared elements function across football matches, tennis fixtures, and racing events. Data collected from each domain includes measurable variables such as speed endurance, recovery intervals, and decision frequency under pressure, while statisticians map these variables onto common scales that allow cross-referencing without forcing direct equivalence.
Core Indicators Shared Across Disciplines
Football analysts record metrics like distance covered at high intensity, pass completion under fatigue, and positional recovery time after transitions, whereas tennis statisticians log rally length averages, serve speed consistency, and movement efficiency on different court surfaces. Racing data sets capture sectional times, stride frequency changes, and heart rate recovery windows between efforts, yet all three sports produce numbers that reflect an athlete's capacity to sustain output after repeated stress. Observers note that combining these figures into unified databases reveals correlations, such as how high-intensity running totals in football align with rally endurance in tennis when both are normalized for duration and environmental conditions.
Integration Techniques Used by Analysts
Teams apply normalization formulas that adjust raw values for sport-specific contexts before merging them into composite scores, and machine learning models then test these scores against historical outcomes to identify which combinations improve forecast accuracy. One research group at a European sports science institute developed a weighted index that treats late-match sprint counts in football as comparable to final-set movement distances in tennis, while another project incorporated post-race lactate clearance rates from thoroughbred events as proxies for recovery speed in team sports. These approaches rely on large data repositories that aggregate match logs, fixture schedules, and event timing sheets, allowing algorithms to detect patterns that single-sport models overlook.
Examples of Refined Projections in Practice
Take one analysis team that examined player workloads across a European league season alongside concurrent tennis tournaments; the model adjusted expected goal probabilities when footballers showed reduced high-speed running metrics that mirrored fatigue signatures observed in five-set tennis matches. Another case involved racing form guides where horses demonstrating strong mid-race acceleration were cross-referenced with football teams that maintained high press intensity late in games, producing updated probability distributions for both upcoming fixtures and race results. Data shows these layered inputs reduce variance in long-range forecasts, particularly when events occur close together on the calendar and share similar physical demands.
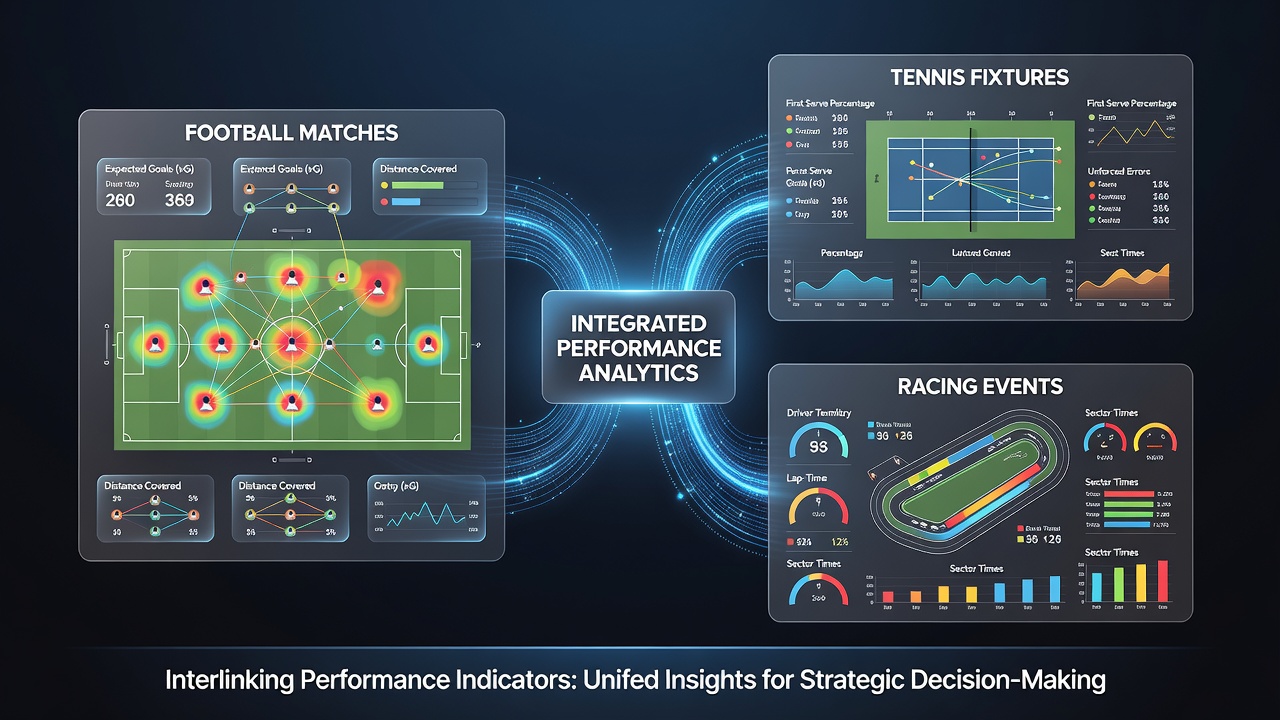
Calendar Pressures and 2026 Scheduling Overlaps
June 2026 features a compressed international schedule that places major football tournaments alongside tennis majors and prominent racing festivals, creating natural test beds for multi-sport indicator models. Analysts track how compressed recovery windows between events affect performance baselines, using historical data from prior overlapping periods to calibrate current projections. Figures from international federations indicate that athletes and teams competing across disciplines during these windows exhibit measurable shifts in key indicators, which integrated systems capture more effectively than isolated sport-specific tools.
Challenges in Cross-Domain Mapping
Differences in measurement protocols, surface variables, and scoring systems require careful calibration before indicators can be linked, and statisticians address this by building sport-specific adjustment layers that sit above shared core variables. Validation studies compare model outputs against actual results from mixed-event periods, confirming whether the added complexity yields consistent gains in precision. Researchers continue to refine these layers as new tracking technologies supply higher-resolution data from each domain.
Conclusion
Integrated performance indicator frameworks draw from football matches, tennis fixtures, and racing events to generate projections that account for overlapping physical and tactical demands, with ongoing work focused on improving data harmonization and validation methods. As schedules intensify around major 2026 gatherings, the value of these cross-sport linkages becomes more apparent to those maintaining comprehensive analytical systems.