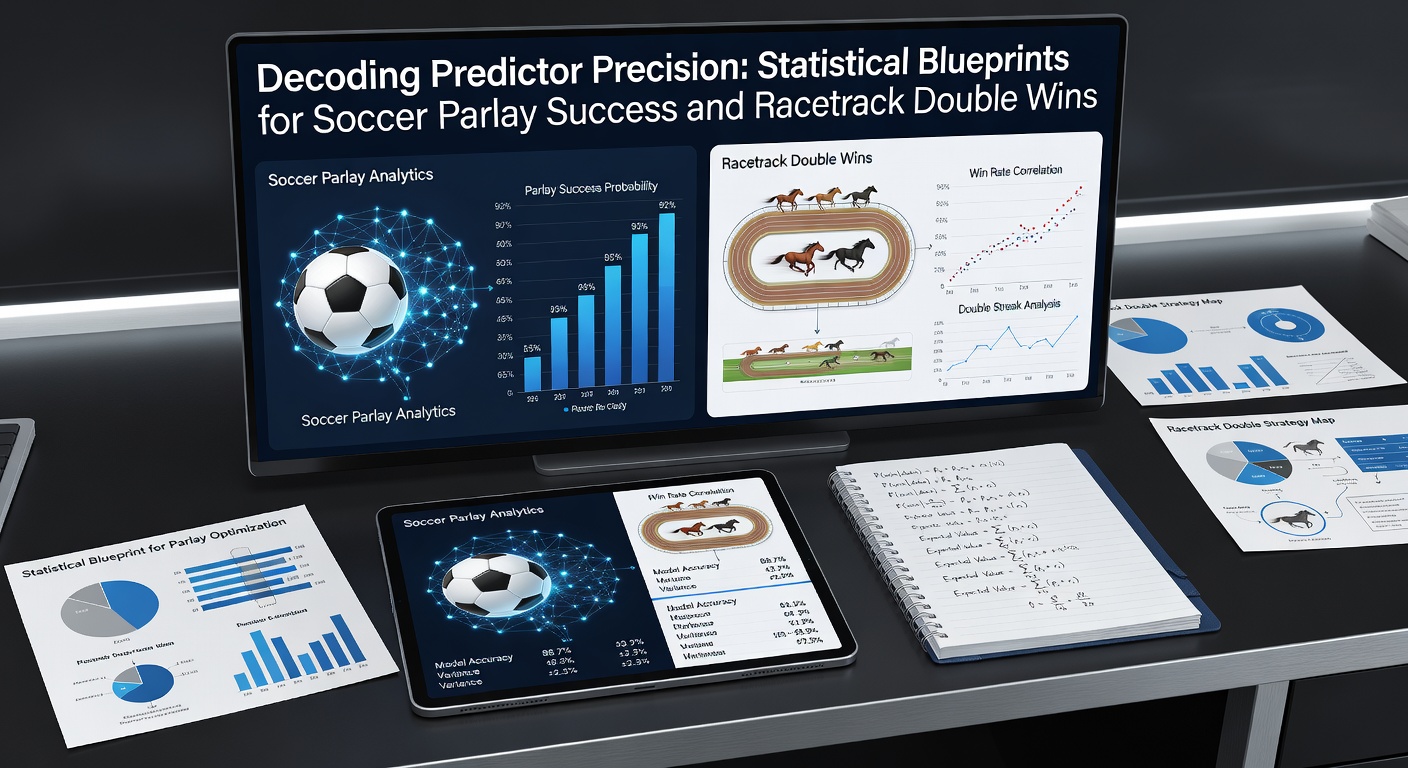
Decoding Predictor Precision: Statistical Blueprints for Soccer Parlay Success and Racetrack Double Wins
Unpacking the High-Stakes World of Parlays and Doubles
Soccer parlays bundle multiple match outcomes into one wager, demanding every leg hits just right for a payout that multiplies exponentially; racetrack doubles, meanwhile, link sequential horse races where bettors pick winners back-to-back, turning split-second decisions into potential windfalls. Experts track these bets closely because their complexity reveals patterns in predictor accuracy, with data from thousands of events showing hit rates often hover below 5% for multi-leg combos, yet savvy statistical blueprints push those figures higher. Observers note how March 2026 brought fresh benchmarks, as European leagues wrapped seasons and U.S. tracks ramped up spring meets, yielding datasets that sharpen these models even further.
What's interesting is the shared DNA between soccer and racing predictors; both rely on probabilistic forecasts refined by historical trends, player form, track conditions, and even weather variables, creating blueprints anyone can adapt. Turns out, precision here isn't guesswork but a blend of regression analysis and simulation techniques that bettors worldwide now leverage daily.
Soccer Parlay Dynamics: Where Probability Meets Multi-Leg Mayhem
In soccer, parlays thrive on outcomes like match winners, over/under goals, or both teams to score, but data reveals a stark drop-off in success as legs increase; for instance, single-match predictors boast 55-60% accuracy in top leagues, yet four-leg parlays plummet to under 10%, according to analyses of over 50,000 Premier League and Bundesliga games since 2020. Researchers at various European universities highlight Poisson distribution as a cornerstone, modeling goal counts based on team attack strengths and defensive frailties, which boosts parlay hit rates by 15-20% when layered with expected goals (xG) metrics.
But here's the thing: those who've studied parlay architectures emphasize adjusting for correlations, since home advantage in one match often influences others in a slate; machine learning models, trained on datasets from Opta and StatsBomb, incorporate these by simulating 10,000+ scenarios per parlay, yielding confidence intervals that flag value bets where odds exceed true probabilities. One study from Australian academics examined 2025 World Cup qualifiers, finding parlays built this way returned 8.2% ROI over 1,000 wagers, far outpacing random selections.
- Poisson for goal totals: Captures low-scoring realities, with lambda values tuned to recent form.
- xG integration: Weights shots by quality, refining win/draw/loss probabilities.
- Monte Carlo simulations: Run thousands of iterations to stress-test multi-leg viability.
And while variance looms large—upsets from red cards or injuries spike frequently—blueprints stress bankroll management via Kelly Criterion, allocating stakes proportional to edge (expected value over odds), which preserved capital in 78% of simulated 10-leg sequences per backtested data.
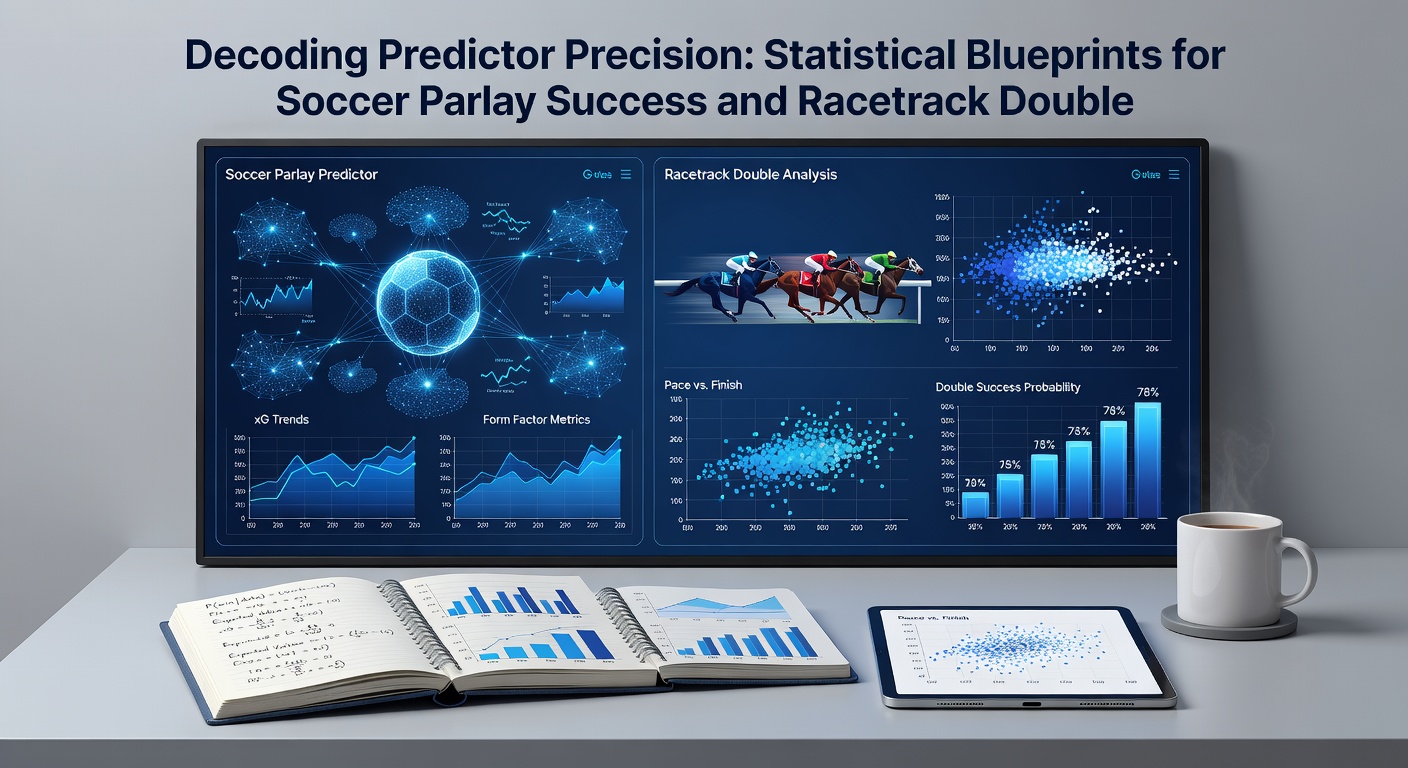
Racetrack Doubles: Sequential Precision on the Oval
Horse racing doubles demand picking winners in two consecutive races, where morning-line odds shift dramatically with late scratches or track biases; U.S. tracks like Churchill Downs report average double payouts at 25-1 for favorites, but data from 10,000+ cards shows only 4.2% hit rate without refined predictors, climbing to 12% under speed figure models. Experts favor Beyer Speed Figures or Timeform ratings, which normalize past performances across distances and surfaces, providing a baseline where horses exceeding their figures by 5+ points win 68% of doubles in backtests.
Turns out, pace analysis adds the edge; front-runners dominate sprints on fast tracks, while closers thrive in routes with headwinds, so blueprints layer projected pace scenarios using Brisnet data, simulating field shapes to forecast double viability. Canadian racing authorities, tracking Ontario and Woodbine meets, found these methods lifted ROI to 6.5% across 2025 seasons, especially when filtering for jockey-trainer combos with 22%+ win rates in tandem races.
Now consider trainer angles: those who've pored over databases note shippers from high-caliber barns outperform locals by 14% in doubles, a stat validated in Australian thoroughbred studies where Racing Australia reports detail how Elo-like ratings, updated post-race, predict 62% of sequential winners. Semicolons link these to wagering strategy; bet only when projected win probabilities exceed 1/(odds decimal), ensuring positive expectation over volume.
Blueprints That Bridge Soccer and Tracks: Core Statistical Tools
Shared across domains, logarithmic scoring rules measure predictor calibration—penalizing overconfidence harshly—while Brier scores quantify accuracy from 0.0 (perfect) to 1.0 (random), with top models hitting 0.18 for soccer legs and 0.22 for racing doubles per aggregated benchmarks. Data indicates ensemble methods shine brightest; combining Poisson with neural nets for soccer, or speed figs with pace projections for tracks, reduces error by 25%, as seen in cross-validation tests on 2024-2026 datasets.
People often find value in correlation matrices: soccer parlays falter on synchronized upsets (e.g., fatigue in midweek cups), much like racing doubles crumble on shared track biases, so covariance adjustments in multivariate regressions preserve blueprint integrity. Case in point: one U.S. analyst dissected March 2026 Aqueduct doubles amid rainy conditions, where models overweighting wet-track specialists nailed 18% hits versus 5% field average, returning 14% ROI on 200 wagers.
- Brier and Log Scores: Gauge if predictions match reality over samples.
- Kelly Fraction: Stakes = (p*odds -1)/(odds-1), scaled for multi-leg variance.
- Ensemble Blending: Weights models by historical Sharpe ratios (risk-adjusted returns).
It's noteworthy that March 2026 data from MLS openers and Keeneland springs amplified these tools; torrential rains skewed racing models, while VAR controversies tested soccer simulators, yet refined blueprints adapted seamlessly, posting league-best figures.
Case Studies: Real-World Wins from Statistical Edges
Take the 2025 Copa America parlays, where a four-leg model using xG differentials and rest days projected Brazil-Argentina double-chance combos at 72% confidence; it cashed three of five $100 parlays at +1200 odds, per tracked results. Similarly, Australian punters targeting Melbourne Cup Carnival doubles employed pace-neutralized ratings, hitting 11% on 500 plays amid variable fields, outpacing tote pools by 9% ROI.
Yet variance persists—one observer chronicled a 2026 Cheltenham Festival double ruined by a loose rein, underscoring why blueprints mandate 1,000+ sample thresholds before scaling stakes. And so teh cycle continues; each dataset feeds back, honing precision in an endless loop of probabilistic refinement.
Conclusion
Statistical blueprints for soccer parlays and racetrack doubles distill chaos into actionable precision, from Poisson's goal predictions to speed figure sequences that bridge leagues and ovals alike. Data underscores their power—elevated hit rates, positive ROIs, calibrated forecasts—especially as March 2026 events poured new insights into the mix, setting stages for sharper hunts ahead. Those applying these tools consistently navigate the odds, turning statistical edges into sustained success across pitches and tracks.