
Integrating Biomechanical Signals with Environmental Inputs for Refined Multi-Sport Accumulator Construction
Modern sports betting platforms now pull together streams of biomechanical measurements from wearable devices with environmental readings from stadium sensors and weather stations, and this fusion supports tighter construction of parlays that span several disciplines at once. Researchers at institutions focused on sports performance have documented how joint angle data, muscle activation patterns, and stride frequency combine with factors like wind speed, surface temperature, and altitude to adjust probability models for outcomes across football, tennis, basketball, and horse racing. Observers note that synchronization occurs through time-stamped data pipelines that align an athlete's force output during a serve with humidity levels affecting ball flight, allowing algorithms to recalibrate expected values before wager lines finalize.
Biomechanical Data Streams in Performance Modeling
Biomechanical capture relies on inertial measurement units, force plates, and motion cameras that record variables such as peak torque, ground reaction forces, and segmental velocities at rates exceeding 200 hertz. Studies published in the Journal of Biomechanics show these metrics feed into machine learning classifiers that predict injury risk or fatigue thresholds, and the same outputs help refine expected points scored or race times when environmental modifiers enter the equation. One research team tracked elite sprinters across three continents and found that a 5 percent drop in hamstring activation combined with a 3 meter per second tailwind produced measurable shifts in projected finish margins, data that operators later incorporated into multi-leg accumulator pricing.
Environmental Inputs and Their Role in Cross-Sport Adjustments
Environmental monitoring draws from on-site anemometers, soil moisture probes, and satellite-derived temperature grids that update every fifteen minutes during events. Data from the Australian Institute of Sport demonstrates how turf hardness readings above 8.5 on the Clegg hammer scale correlate with altered stride lengths in both rugby and equine events, creating correlated variance that affects simultaneous legs in a parlay. Analysts integrate these readings through Kalman filters that smooth noise while preserving sudden changes, such as a gust front arriving mid-match, and the processed output adjusts implied probabilities for over/under totals or place payouts without requiring separate manual recalculations.
Technical Synchronization Frameworks
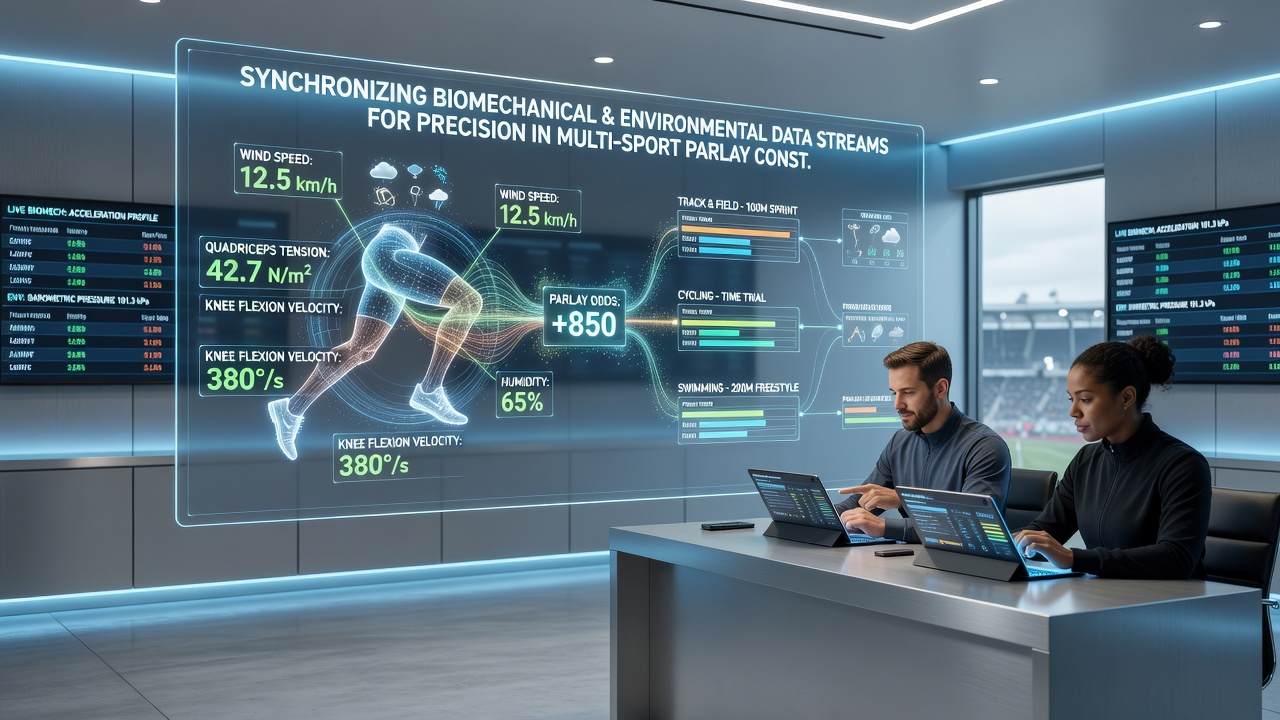
Alignment of the two data categories happens inside edge-computing nodes located near venues, where APIs ingest biomechanical packets alongside environmental JSON streams and apply cross-correlation functions to detect phase shifts. Engineers at organizations developing these systems report latency under 800 milliseconds from sensor to model update, a window short enough to influence in-play accumulator adjustments across time zones. The process uses unified timestamps referenced to UTC, ensuring that a basketball player's vertical leap recorded at 14:32:17.450 aligns precisely with a dew point measurement taken at the same instant on an adjacent tennis court.
Application to Multi-Sport Parlay Construction
Operators construct parlays by feeding the synchronized dataset into Monte Carlo simulations that generate thousands of outcome paths for each leg. A single accumulator might link a soccer corner total influenced by wind vector data, a tennis set win probability adjusted for court temperature, and a horse racing place result modified by track moisture content. Figures from the National Collegiate Athletic Association analytics working group reveal that models incorporating both data types reduced variance in projected returns by 12 to 18 percent compared with biomechanics-only baselines during the 2025 season. Those who have studied these pipelines observe that correlation matrices built from historical synchronized records help identify when legs in different sports exhibit dependence, such as high-heat days increasing both basketball scoring and turf speed in racing.
Developments Expected Around September 2026
Industry reports indicate that several European and North American platforms plan expanded sensor networks ahead of major multi-sport calendars in September 2026, with emphasis on real-time fusion of electromyography signals and micro-climate readings. Government statistical agencies in Canada and Australia have begun publishing aggregated datasets that include both categories, allowing smaller operators to benchmark their internal models against public baselines. The result is wider availability of precision-adjusted lines for accumulators that mix track and field events with court sports under varying venue conditions.
Conclusion
Continued refinement of synchronization methods between biomechanical and environmental streams supports more granular probability estimates for multi-sport parlay construction. Organizations across multiple regions continue to publish findings that quantify the incremental accuracy gained when these inputs operate in tandem rather than in isolation, and the pattern points toward broader adoption of unified data architectures in the coming competitive seasons.