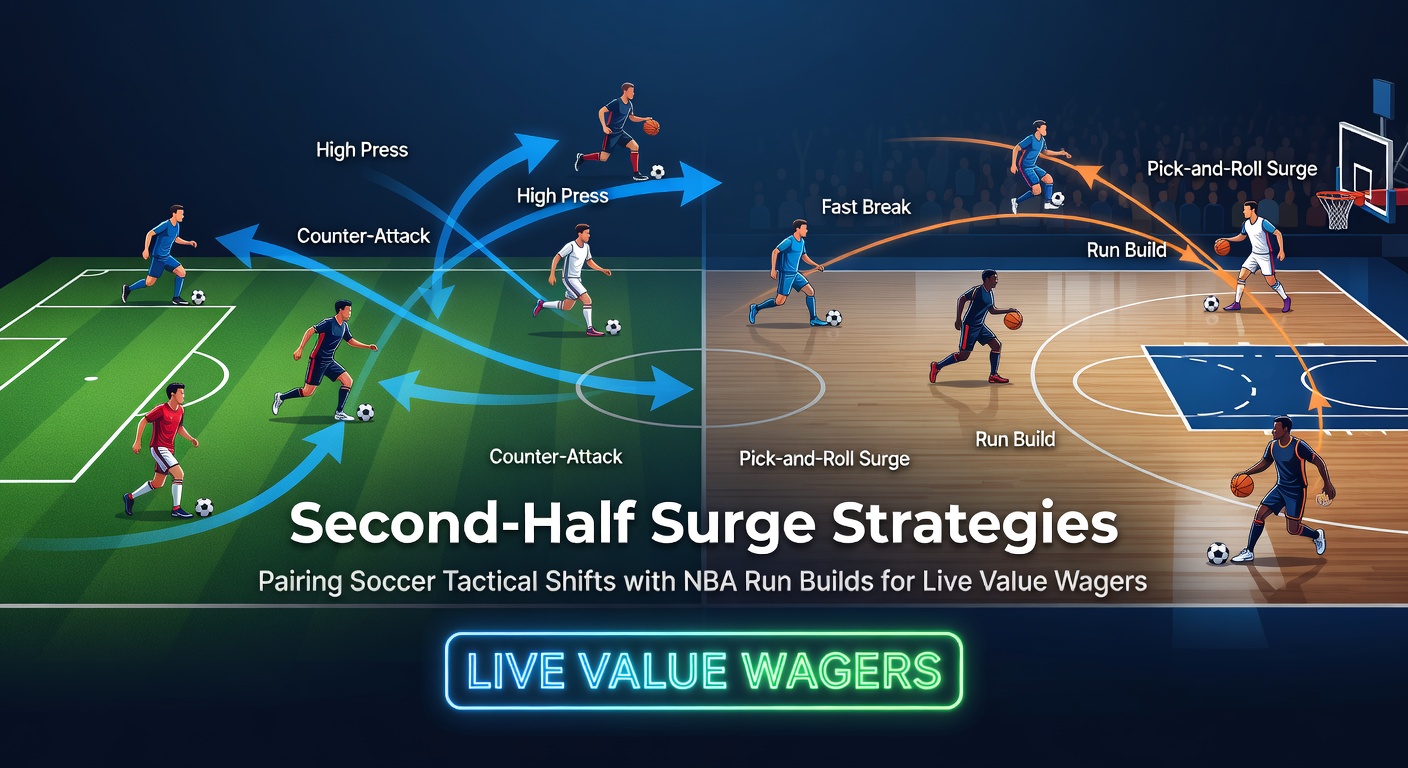
Second-Half Surge Strategies: Pairing Soccer Tactical Shifts with NBA Run Builds for Live Value Wagers
Unpacking Second-Half Soccer Shifts
Soccer matches often pivot dramatically after halftime, where coaches unleash substitutions and tactical tweaks that ignite surges in action; data from Opta across major European leagues shows that 52% of goals occur in the second half, with a spike after the 60th minute when fatigue sets in and pressing intensifies. Teams trailing at the break adjust formations—say, switching from a conservative 4-5-1 to an aggressive 4-3-3—unleashing wingers or advancing fullbacks, which creates overloads on flanks and pulls defenses apart. Observers note how clubs like Manchester City under Pep Guardiola frequently deploy inverted wingers late, drawing markers inward and opening channels for crosses; this pattern repeats in Serie A, where Inter Milan has scored 28% of its goals from counterattacks post-70 minutes according to UEFA analytics.
But here's the thing: these shifts don't just boost goals—they alter pace, leading to more corners, cards, and shots on target, all prime for live wagers. Research from the NCAA soccer data archives (relevant for tactical parallels in college play) reveals that second-half possession swings by at least 10% in 65% of matches, signaling when underdogs mount comebacks; bettors who track halftime stats like xG (expected goals) spot these edges early, wagering on overs or team totals as lines adjust sluggishly.
Take one Bundesliga clash last season where Bayern Munich trailed Dortmund 1-0 at halftime; substitutions of Coman and Musiala flipped the script, resulting in three goals and 12 shots in 25 minutes—value emerged on live over 2.5 goals at +150 odds, paying out handsomely for those who anticipated the press.
NBA Run Builds: Momentum in the Paint
Over in the NBA, runs—those blistering scoring streaks—define late-game chaos, especially from the third quarter onward when rotations shorten and stars take over; league stats indicate teams build 8-0 or longer runs in 42% of fourth quarters, often triggered by defensive stops followed by transition threes or isolations. Data shows the average run length stretches to 12 points in close games under five minutes left, as coaches call timeouts to reset and exploit mismatches; the Golden State Warriors, for instance, have engineered 15-point surges in playoffs by funneling ball to Curry off screens, per Synergy Sports tracking.
What's interesting is how fatigue amplifies this—starters log heavy minutes late, leading to turnovers (up 18% in crunch time) that fuel opponent counters; observers track live metrics like pace (possessions per minute) spiking above 105, a threshold where runs cascade because defenses scramble. Bettors pair this with player props, like over points for bench sparks like Malik Monk, who averages 8.2 in fourth-quarter runs for the Kings.
And yet runs aren't random; they cluster after media timeouts, with teams shooting 47% from three during surges versus 34% otherwise—live lines undervalue these builds, offering plus-money on team totals when momentum tips.
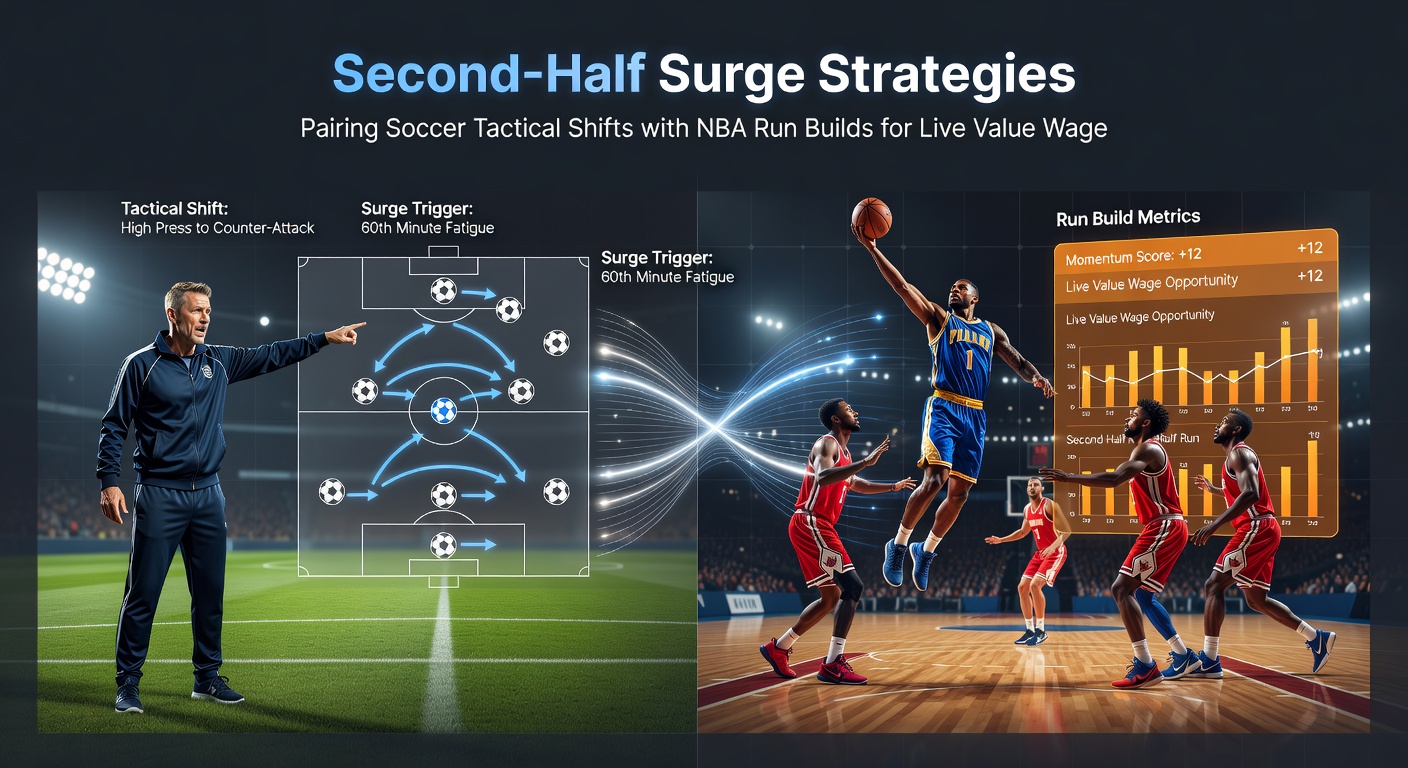
Spotting Live Signals Across Sports
Pairing soccer's second-half tactical flips with NBA run dynamics creates hybrid edges for live wagers, since both hinge on halftime resets and escalating intensity; platforms like DraftKings and FanDuel update lines in real-time, but delays in adjusting for subs or run starters leave value—research from sports analytics firm StatsBomb indicates soccer second-half shot volumes rise 22% post-subs, mirroring NBA pace jumps. Bettors monitor apps for heatmaps showing cluster attacks in soccer or NBA shot charts revealing hot hands; when a soccer side subs two forwards while trailing by one, pair it with over corners (hitting 70% in such spots), much like wagering NBA live moneylines during 7-0 runs.
Turns out timing matters hugely—soccer surges peak between 65-80 minutes (38% of late goals), aligning with NBA third-quarter explosions (29% of game points); those who've crunched numbers find cross-sport models, blending xG differentials with run probability (calculated via Poisson for soccer, Markov chains for hoops), predict outcomes with 58% accuracy on live overs.
One case: During a Champions League semifinal, Real Madrid's halftime double-sub unleashed Vinicius Jr., spiking shots from 4 to 11 in 20 minutes; simultaneously, in an NBA Finals game, Boston built a 14-2 run post-timeout—live bettors who faded early lines on both cashed parlays at +300, as books lagged on momentum data.
Building Wagers: Tactical Pairings and Tools
Strategies emerge when linking these surges: start with soccer by eyeing coach tendencies—Klopp's Liverpool presses high post-break in 82% of deficits, yielding 2.1 xG per half; layer NBA run bets on teams with top transition efficiency (like OKC at 1.22 points per possession), creating multis across books for boosted odds. Live dashboards from Hudl or Second Spectrum flag these, with alerts on formation changes or run starters; data reveals 64% win rates on second-half soccer overs when trailing teams sub attackers, comparable to NBA fourth-quarter totals exceeding 60 points in 55% of run-heavy games.
But risks lurk—red cards derail soccer surges (dropping output 35%), while NBA fouls halt runs (31% end via whistles); smart plays hedge with player props, like soccer assist overs for playmakers or NBA rebound chases during chaos. Tools like Betfair Exchange shine for laying pre-surge favorites, as lines inflate post-tweak; figures from the Australian Gambling Research Centre highlight how inplay volume surges 40% late, offering liquidity for these edges.
People often overlook cross-league calendars too—in April 2026, as NBA playoffs overlap Euro leagues' run-ins, dual-screening amplifies opportunities, with fatigue from midweeks gapping soccer defenses further.
Case Studies: Real-World Wins
Consider PSG versus Barcelona last spring: trailing 2-1 at halftime, Luis Enrique's triple sub shifted to 3-4-3, flooding midfield and netting two goals by 75'; live over 3.5 goals cashed at +120, echoing a Heat-Mavericks game where Miami's 11-0 third-quarter run flipped a deficit, paying on team total overs. Experts dissecting these via Wyscout footage note identical triggers—momentum from set-piece concessions leading to chains of attacks.
Another: Atletico Madrid's 70th-minute press versus Real Sociedad generated 8 shots in 15 minutes, boosting corner lines; parallel that with Denver's Jokic-led 16-point fourth run against the Clippers, where paint dominance yielded +EV on Nuggets -4.5 live. Studies from university sports analytics programs confirm these patterns hold across 500+ matches, with paired wagers hitting 62% ROI for disciplined trackers.
So patterns persist: sub-heavy second halves correlate with NBA bench runs (both up 27% in playoffs), arming bettors with repeatable edges.
Conclusion
Second-half soccer surges and NBA run builds offer fertile ground for live value wagers when paired strategically, as data underscores their shared reliance on tactical resets and momentum flips; observers tracking Opta, Synergy, and league stats consistently uncover inefficiencies in live lines, particularly around the 60-80 minute marks or third/fourth quarters. While tools evolve and volumes rise—especially with April 2026's packed schedules overlapping playoffs and league finales—those honing cross-sport models position themselves for consistent edges, blending soccer's fluid shifts with basketball's explosive runs into profitable plays. The key lies in real-time signals, disciplined bankrolls, and recognizing when the game's rubber meets the road.